
Share Your Data Story

Don’t get scared off by the word data. Let’s share our big wins! Work is stressful for sure but just think about all that you and your students have accomplished. This data is not about reaching goals or monitoring progress. This is about sharing YOUR data story. Download the freebies to get started.
How are you changing the world?
What are you proud of?
Sometimes when we step back and take a look at the big picture, we realize WOW we accomplished so much.
A superintendent shared this idea with me and I thought it was amazing. Teachers, related service professionals, and school staff work so hard every.single.day and when you put numbers on it like this, it is truly mind-blowing!
Remember, this isn’t about accuracy it is about generalizations of the numbers to validate your hard work and instill pride in your students!
You can download a FREE packet to help you get started.
How to Tell Your Data Story
What is a data story? It is simply using numbers to show quantitative data of what you do all school year long. It should not be tedious but FUN!
Here are some examples of things you may have accomplished this year. You can fill in the blanks using a simple estimation to get your data. This is nothing fancy.
Reading Teacher Data Story Example
For example, if you do something with your 20 students for 20 minutes per day and they have school for about 180 days, you influenced those students for 72,000 minutes!
WAIT WHAT? – let’s check that: 20 students x 20 minutes per day =400 minutes of reading per day x 180 days = 72,000 minutes of reading!
Reading Teacher Data Story: My students have read for 72,000 minutes this school year!
Fill in your blanks: _________# of students x __________# of minutes practiced per day x 180 days per school year = AMAZING WORK!
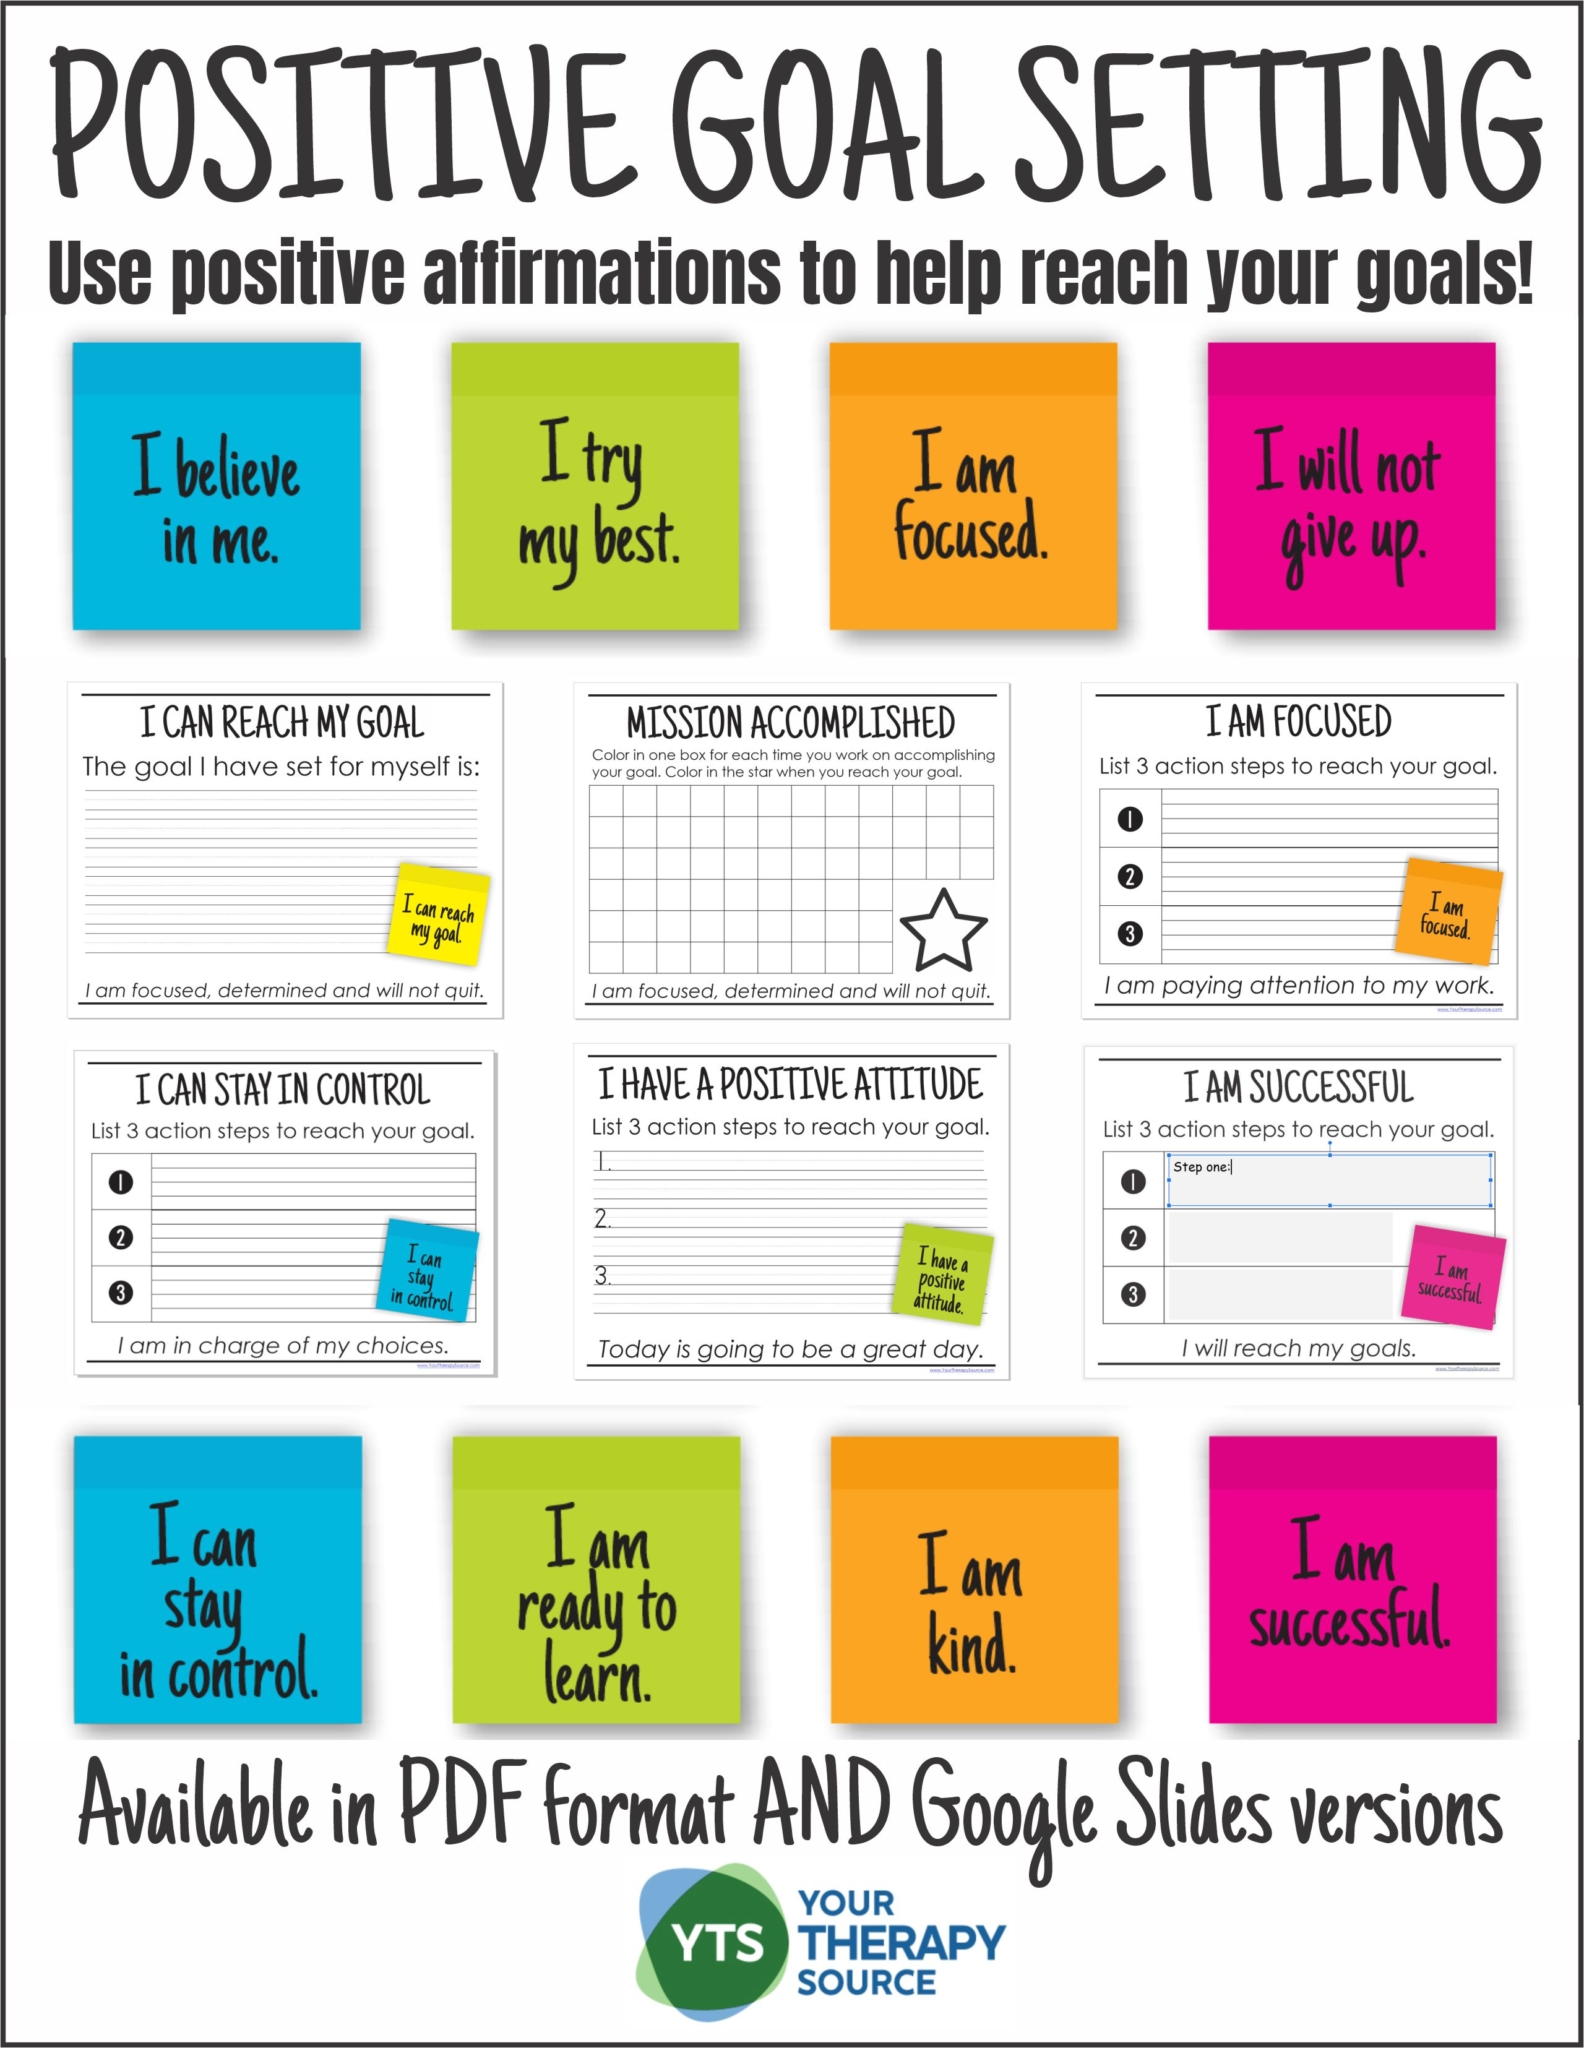
Positive Goal Setting
Occupational Therapy Data Story Example
This is an easy example and the numbers will be big for some of you! Let’s say you provide related services for 100 students. Your average for all of your students is 1 session per week. You practice fine motor skills for around 20 minutes per week. Students go to school for about 36 weeks a year (180 days/5 days per week = 36 weeks)
Let’s do the math ( and remember this is not exact it is just generalizations to give you a big picture)
20 minutes per week x 36 weeks = 720 minutes a year x 100 students = 72,000 minutes of fine motor practice per year.
Occupational Therapy Data Story: My students have 72,000 minutes of fine motor practice this school year!
WOW – did you realize that you were providing that much fine motor skill practice to kids? That is impressive right?!?
Handwriting or Writing Data Story Example
Maybe your students complete a writing prompt every day for their morning work. If you have 25 students over 180 days, you could share “My students have completed 4500 writing prompts this year.”
Want to make it look even more amazing? If they wrote 3 sentences for each writing prompt that would be 4500 writing prompts x 3 sentences = 13,500 sentences!
“My students have written 13,500 sentences this year for their morning work.”
Physical Therapy Data Story Example
Let’s say you help the 50 students on your caseload participate in recess through direct and consultation services. Your students practice playing games with friends and climbing playground equipment 20 minutes every day during recess. Let’s do the math: 20 minutes per day x 50 students = 1000 minutes per day x 180 days = 180,000 minutes per year of recess time!
“My students have practiced their motor skills for 180,000 minutes of recess this school year!
Movement Breaks Data Story Example
We all know how much movement can influence learning in the classroom.
Do you do brain breaks every day? If you have been in school for 180 days and each brain break is 10 minutes, you could share “My students completed 1800 minutes of brain breaks to get their mind and body ready to work.”
Have an entire classroom doing brain breaks? Let’s get that number even higher!
Let’s do the math: 20 students x 10 minutes of brain breaks per day = 200 minutes of brain breaks per day x 180 days = 36,000 minutes of brain breaks per year!
“My students have completed 36,000 minutes of brain breaks this year”

Physical Education Data Story Example
I just realized that if I want REALLY BIG numbers, I have to include an example for physical education. These teachers see the most children in the entire school district.
Again these are averages and rough estimates – Let’s say a PE teacher has 6 periods a day to teach. Each period has 25 students in it. Students participate in 2 gym classes per week. During each PE class students are participating in 30 minutes of physical activity.
Drumroll please………
Let’s do the math: 25 students x 6 periods a day = 150 students per day x 30 minutes of physical activity = 4500 minutes of physical activity per day x 180 school days = 810,000 minutes of physical activity per year!!!!
“My students have completed 810,000 minutes of physical activity per year.”
Make a Bulletin Board to Display Your Data Story
See how fun this is! Wouldn’t it be AMAZING to have a bulletin board at school for everyone to add notes to share their data story? You can download these FREE printables to start creating your data story to show everyone how you and your students are MAKING BIG THINGS HAPPEN!
DOWNLOAD YOUR FREE PRINTABLES TO SHARE YOUR DATA STORY
Thank you for your interest. Sign up to receive the biweekly email newsletter and other announcements from Your Therapy Source. You will be redirected to the freebie. If you can not see the sign up box, click on the blue box in the lower right hand corner for help.

